Winning the War against Analysis Paralysis
The “founder” of TMI asks, How much is more analysis worth?
Just because something can be done doesn’t mean that it should be done.
A few customer encounters this past month caused an issue to ricochet around in my mind like a 1970s pinball machine. I’m referring to a trap we’ve all fallen into: analysis paralysis.
Three interrelated definitions I have for analysis paralysis are worth enumerating:
- The condition of being indecisive while overanalyzing alternatives. (Classic analysis paralysis.)
- Allowing a project to mushroom into something bigger than it needs to be to get the job done. (This column is a good example.)
- Using data from the most expensive tools you own just because you have the tools or the data (e.g., it’s expensive and took a lot of time, so it must be good).
It’s not that analysis or expensive tools aren’t good, but their employment is an optimization process.
Relative to the above, I can’t and won’t lecture on trying to rely on overanalyzing things or using “too much information” as if I have a solid handle on it. When non-engineers say to me, “That’s TMI,” I say, “I invented TMI.”
Perhaps my first (but probably not the first) major encounter with this problem was my final semester as an undergraduate engineering student. The class was computer-aided design, and our final project was to develop a CAD program to solve an engineering problem. Every decision I made on the project was ill-advised. I spent hundreds of hours writing thousands of lines of code alone in the bowels of the open-all-night engineering labs, writing a masters-thesis program for an undergraduate class. Stupid, stupid, stupid. It consumed me. I kept adding features, and I somehow thought this program that would never see daylight had to optimize a heat-removal problem for a hypothetical nuclear power plant. A rendering of me in the all-night engineering labs is shown in FIGURE 1.1
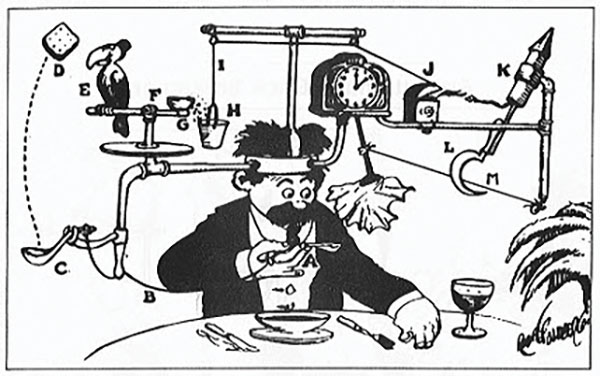
FIGURE 1. Cartoonist Rube Goldberg’s depiction of Professor Butts and the Self-Operating Napkin (1931). Soup spoon (A) is raised to mouth, pulling string (B) and thereby jerking ladle (C), which throws cracker (D) past toucan (E). Toucan jumps after cracker and perch (F) tilts, upsetting seeds (G) into pail (H). Extra weight in pail pulls cord (I), which opens and ignites lighter (J), setting off skyrocket (K), which causes sickle (L) to cut string (M), allowing pendulum with attached napkin to swing back and forth, thereby wiping chin. (Public domain; originally published in Collier’s, Sept. 26, 1931.)
I’m obviously not the only one who has struggled with this. Lee Ritchey once quoted his CPA as saying, “Electrical engineers were the smartest dumb people … designing all sorts of innovative, clever products, but often having no idea what things cost and often seeming not to care or thinking cost containment was part of the job. These same engineers had the financial success or failure of the company they worked for in their hands and didn’t seem to know it.”2
What I want to focus on here is the cost in terms of time and effort. We should always ask, “How much is more analysis worth?”
Here are the questions that crossed my radar last month while abstracting the discussion to address anyone who’s ever wrestled with TMI and analysis paralysis:
- While demonstrating some cool productivity-enhancing stackup-design features, a guy interrupts the demonstration to ask, “Some tools do Monte Carlo analysis. Does this do Monte Carlo analysis?” (Note: completely orthogonal to the discussion.)
- Can you make the software do something with an invalid modeling premise, utilizing our existing VNA measurement data, while collaborating with a third-party tool?
I won’t discuss question two in detail here, but I’m reminded of several parallels that have been bouncing around in my head since these questions popped up.
Time to shoot the engineers and ship it (T2SE). I’m not sure who coined this phrase, but I’m glad they did. It’s not intended to mean “ship shoddy products.” It says engineers, left to themselves, may tend to lose sight of profitability in favor of “further analysis.”

FIGURE 2. All models are wrong, but some are useful. (Image courtesy of Todd Westerhoff, Siemens EDA.)
Sir R. A. Watson-Watt, the inventor of radar, described how a “good enough” design led to a turning point in World War II. “The best design had to be rejected because it would never be achieved, and … the ‘second best’ would be achieved too late to be used by the armed forces when they needed it. The third best would be adequate and was available in time, and it was what won the Battle of Britain.”
All models are wrong, but some are useful. George Box, another Brit, was a statistician known for his work in quality control and experimental design. This quote is actually a paraphrase of Box’s 1976 paper3, which is generally considered the earliest source. The full quotation is, “Since all models are wrong, the scientist cannot obtain a ‘correct’ one by excessive elaboration. On the contrary, following William of Occam (“Occam’s Razor”), he should seek an economical description of natural phenomena. Just as the ability to devise simple but evocative models is the signature of the great scientist, so overelaboration and overparameterization is often the mark of mediocrity.”
Amen, Brother Box.
Embrace this and you’ll be free to get actual work done, rather than stressing about searching for the Holy Grail.
When the Monte Carlo question came up, I thought of the sign in FIGURE 3. Two trails circle the Lava Canyon on the south side of Mt. St. Helens, connected by a suspension bridge. Living as I do in the Pacific Northwest, I’ve made this hike many times with my family. The northern route is treacherous, and the southern side is more manageable. Regardless of the route (I take the southern one), if you get close to the edge, as some have done, you can end up a statistic. I’ve never performed a Monte Carlo analysis of US Forest Service data on wind direction, coefficients of friction, time of day (light/darkness), temperature, precipitation, etc. Instead, I simply assess where my feet and kids are relative to the failure criteria. I don’t do the hike in the middle of the night or in the rain, for example. We all survived, not because we performed detailed statistical modeling and analysis, but because we used good, old-fashioned common sense and stayed on the trail – just as I recommend here for PCB stackup design.

FIGURE 3. Sign on Lava Canyon Trail, on the south side of Mount Saint Helens.
Everything should be as simple as possible. Albert Einstein famously said, “Everything should be as simple as possible (but no simpler).” A Russian engineer reminded me of a story that speaks to this.
A billionaire wanted to develop a method to predict which horse would win races. He gave the task to a biologist, a mathematician, and a physicist. They had months to come back with an answer, and the successful proposal would get a million dollars.
The biologist said, “Well, if I know the exact pedigree of the horse, the success of its parents, how it was fed, how it was treated, I can accurately predict a horse’s maximum speed.”
The mathematician said, “If we have accurate statistics on previous races, I can predict the approximate results of this …”
The physicist said, “With 10 years, 50 million dollars, a lab and a staff, we can predict the outcome. I’ve already built a model of the motion of an elastic, spherical horse in a vacuum!”
I guess the good news is you can model it in the frequency domain if you know the radius …
Management implications. Peter Drucker, the Mark Twain of management authors, is the guy who coined the term “knowledge worker.” One of the reasons I like him is he says things like, “There is nothing quite so useless as doing with great efficiency something that should not be done at all.”
It’s been said that when you have a hammer, every problem looks like a nail. From my recent experience, I’d say a corollary is, “When you have an expensive VNA and a bunch of measurement data, you’ll be tempted to look for unreasonable places to use it, even if it goes against common sense.” I see this in day-to-day interactions more often than you might think.
In decision theory, the expected value of perfect information (EVPI) is the price one would be willing to pay in order to gain access to perfect information. It’s an attempt to assess how much we’d be willing to pay for a perfect answer or a perfect model with zero risk. Perhaps without knowing it, this is what we’re pursuing with many simulations and simulation models. Return on investment (ROI) always needs to be factored in.
An informal, possibly unspoken part of an engineering manager’s job is to keep their team from going sideways on projects by analyzing things to death. The problem is it’s an optimization process, and engineering managers may not have a clear handle on the “value of perfect information.” Communication is key here, and engineers are attracted to complexity like moths to a flame.
Back to Monte Carlo analysis. I suppose most readers know what Monte Carlo simulation is, but here’s a brief explanation. According to Wikipedia, Monte Carlo experiments rely on repeated random variation of multiple parameters to solve problems that are difficult or impossible to solve using other approaches.
Monte Carlo analysis clearly has a place, but you need to have good process and process-variation data to make it work. Theoretically, Monte Carlo analysis would give the expected limits of the actual outcome (with confidence factors). Even if you could do it, putting in valid data for the different process variables and sufficient data to be statistically relevant is a massive challenge. And it would not likely be consistent across multiple fabricators.
EDA (electronic design automation) tools, including those made by my company, can be super-useful, if you know what they are really modeling. Even here, the results are only as good as the data put in. As an example, most roughness models are “wrong,” but useful and needed.
In the context of this discussion the dependent variable of interest is impedance. The primary parameters that affect impedance are shown in TABLE 1, including their relative contributions.5
TABLE 1. Factors Influencing Impedance
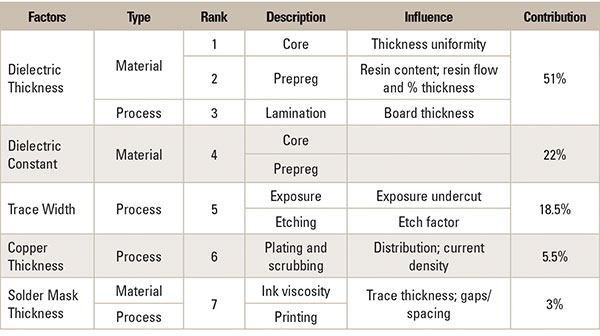
Virtually everything I do is focused on getting these parameters right. If you work this list top to bottom, starting with getting a better handle on dielectric thicknesses and working your way down, you’ll be better equipped to dial in your nominal parameters with enough margin to know you’re not going to fall off the cliff. And yet every week, I see engineering teams straining to perform complex analyses using datasets with questionable merit, without fully grasping the parameters and priorities (1 through 7) noted above.
With enough effort and data gathered over time, we can eventually model all the above using statistical methods like Monte Carlo. FIGURE 4 shows the results of tons of effort.
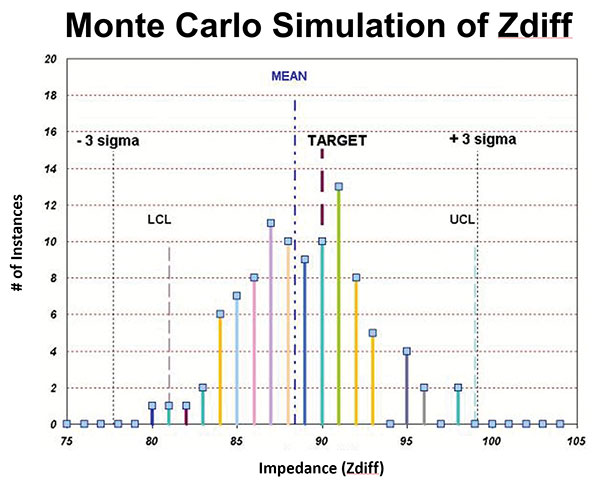
FIGURE 4. Differential impedance distribution from Monte Carlo simulation. (Data courtesy Happy Holden.)5
Conclusion
Detailed statistical analysis is a reasonable enterprise for a materials or process guru. But it’s a ton of work and unless you’re paid to do science projects, it’s probably not worth it. If your main work product is to get products that work into production, it’s probably sufficient to understand where you are relative to the edge of the cliff. Do the best you can with the seven parameters noted above, and you should be fine.
Do everything you can to reduce or remove unknowns, by all means, but use common sense before leaning into modeling methods and tools that give an artificial sense of comfort.
I’ll wrap up with a comment I heard from a wise engineering manager over 20 years ago: “I want to know what time it is, not how to build a watch!”
Shoot me an e-mail if you agree. Bonus points if you include an example!
References
- Wikipedia, Rube Goldberg Machine, https://en.wikipedia.org/wiki/rube_goldberg_machine, retrieved February 2021.
- Lee Ritchey, Right the First Time: A Practical Handbook on High Speed PCB and System Design, vol. 1, 2003.
- George E. P. Box, “Science and Statistics,” Journal of the American Statistical Association, vol. 71, no. 356, December 1976.
- GoodReads.com, www.goodreads.com/author/quotes/12008.peter_f_drucker, retrieved February 2021.
- Happy Holden, e-mail correspondence.